Using Technical Analysis Indicators to Improve Elliott Wave Analysis
Elliott Wave Theory alone is really quite useful in understanding what the market is doing and where it is headed. But using other technical analysis techniques can provide some helpful confirmation to the analysis. We'll be looking at two sets of indicators. The first set is the default settings for RSI, Stochastics, and MACD. (Note the RSI has lines at 70, 60, 40 and 30) As a general rule, if you shorten the time period of these indicators you are likely to see more prominent peaks and valleys. You are encouraged to try other settings for these common indicators and other indicators to see what works best for you. The second chart shows our standard indicators, which can include a modified Ergotic indicator and a modified Fisher Transform indicator. Both of these have momentum bands surrounding them, which is another lesson.
On both sets, pay attention to where the peaks and valleys occur with respect to the levels (above or below the Overbought/Oversold, the Zero Line, and the 60/40 reversal zones on the RSI. Being above or below these areas definitive, but they are helpful in the analysis. What is more important is the relationship between the peaks and troughs. (Lower highs)
Match the timeframe to the degree you are observing
It is not going to do you much good to try to analyze a minor degree wave on a 5 minute chart. You just won't get much use out of the indicator. Same is true using a daily chart to analyze a Micro degree wave. You should use the chart on which you are analyzing the wave degree in question. From there you can raise or lower the time frame a bit in order to determine what time frame is working best for that degree of wave. It is particularly important to note that when you are analyzing one degree of waves, you are in actuality reviewing the wave structure of one lower degree (or two or more lower degrees if you are analyzing an extension). Is the time frame you selected providing information about these lower degree waves? If so, you are good to go.
Indicator Signatures
Indicators and oscillators have pretty common signatures which can be helpful to correctly identifying your wave count. Contrary to what you might expect, Indicators do not register their highs and lows at wave 5. The charts below willl demonstrate that the indictor highs and lows are almost always often registered at the end of wave 3s and usually wave 3 of the preceding smaller degree or, in the case of an extended wave, at the end of wave 3 of 2 smaller degrees.
Bull Market Indicator Signatures During Extended Impulse Waves
Because the extension of an impulse wave raises multiple small degrees of impulse waves into the time frame you are examining, it is necessary to draw a distinction between what indicator signatures will look like during an extended impulse wave as opposed to a regular impulse wave.
Extended Wave 3 of Larger Degree Wave 1
Below are two charts showing the indicator signatures during an extended wave 1.
Below are the common TA indicators at their default settings from most charting programs. Note the divergence between the higher prices as the extended wave progresses
and the lower high peaks on the indicators.
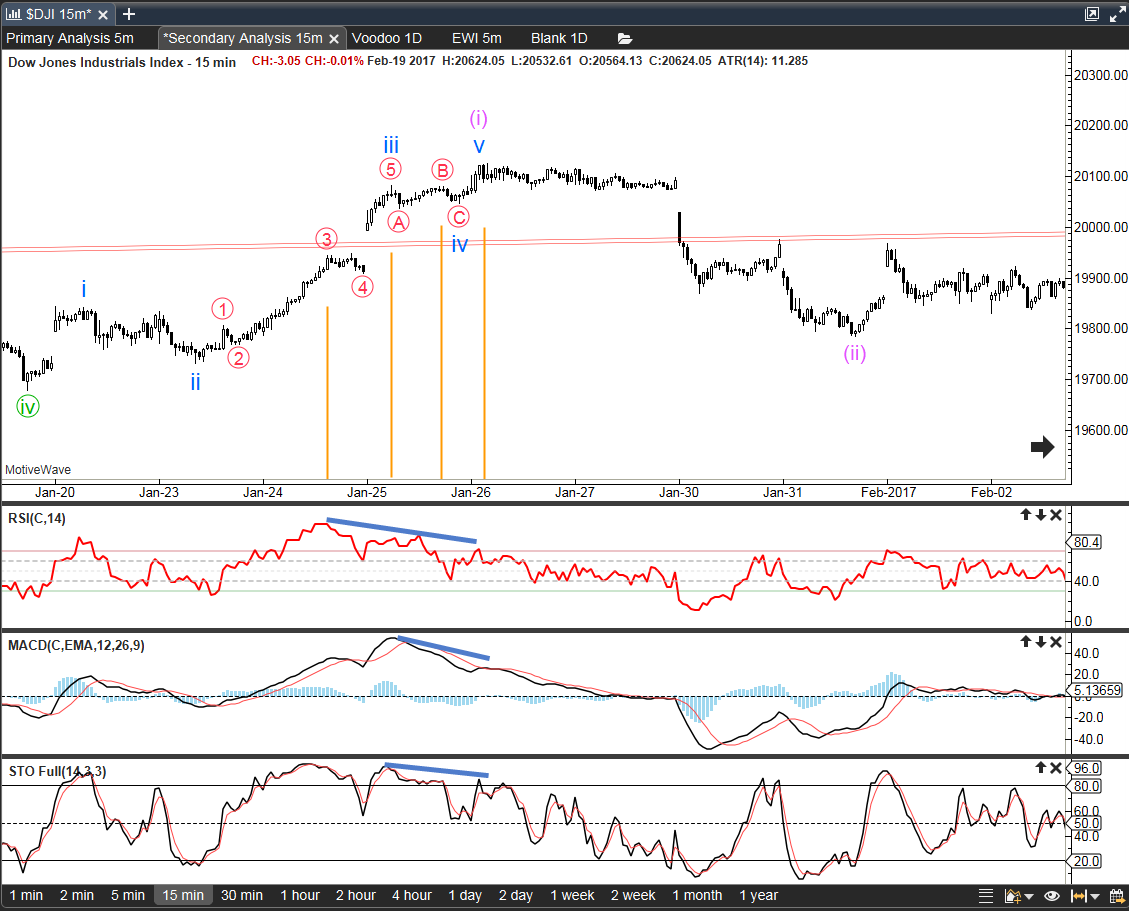
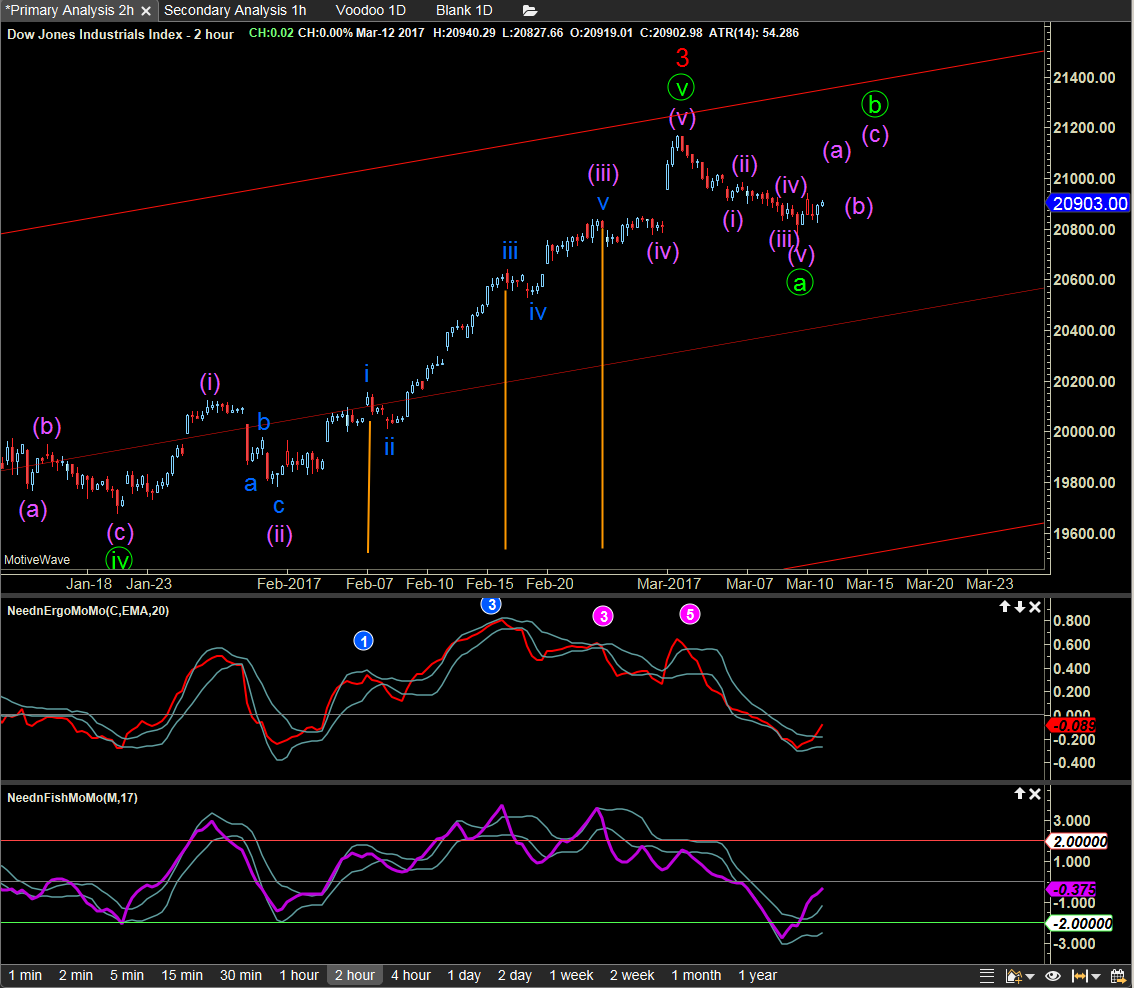
The chart below shows our standard indicators.
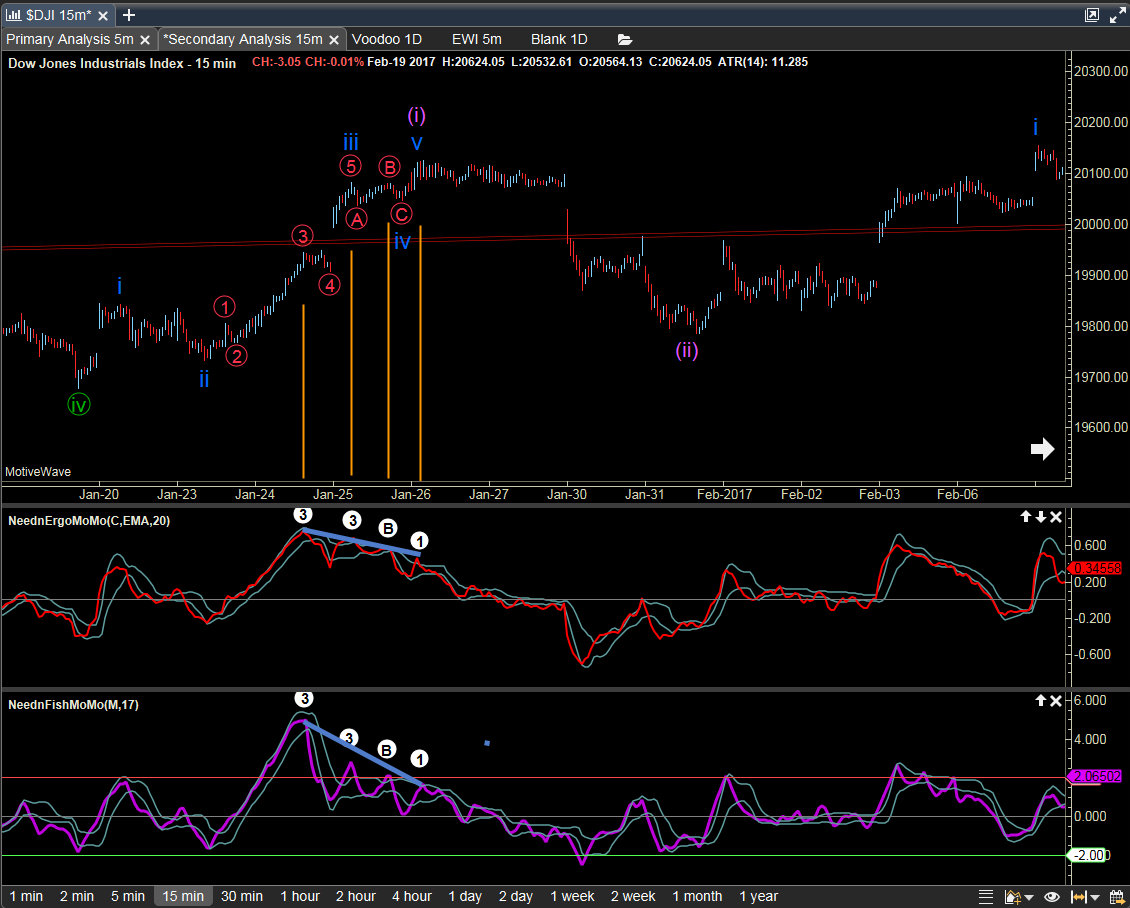
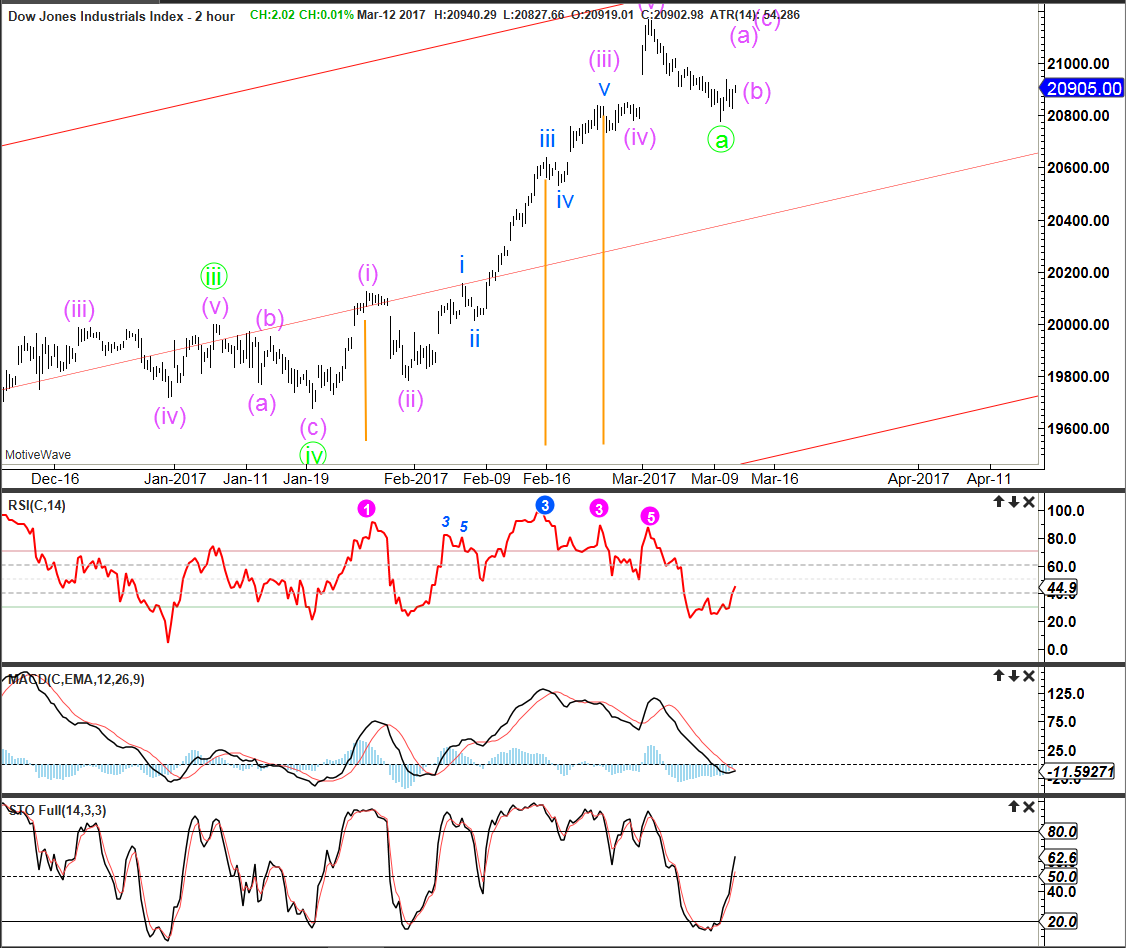
Extended Wave 3 of Larger Degree Wave 3
Note for the charts below that we are still measuring a pink Minuette wave, this time wave 3. But because of the extended nature of the wave we have had to raise the chart time by a factor of 8, from 15 minutes to 2 hours in order to filter out the noise from the smaller waves in the extension.
Some things to note in the charts below. First, the signatures for the extended wave 3 are pretty much the same as the extended wave 1. The lesser degree wave (iii) creates the highest peak, followed by the end of wave (iii) at a lower peak. To complete the wave, the 5th wave (V) peaks even lower than the prior wave 3 of the same degree.